

Adobe software is widely used for graphic design, video editing, and other creative tasks. However, it can be frustrating when Adobe software keeps crashing, disrupting your workflow. If you are facing this issue, don’t worry – there are several solutions you can try to resolve the problem.

How to Edit Text in Adobe Acrobat
Adobe Acrobat is a powerful tool that allows you to create, edit, and manage PDF documents with ease. One common task users often need to perform is editing text within a PDF file. Whether you need to correct a typo, update information, or make formatting changes, Adobe Acrobat makes it simple to edit text directly within the document.
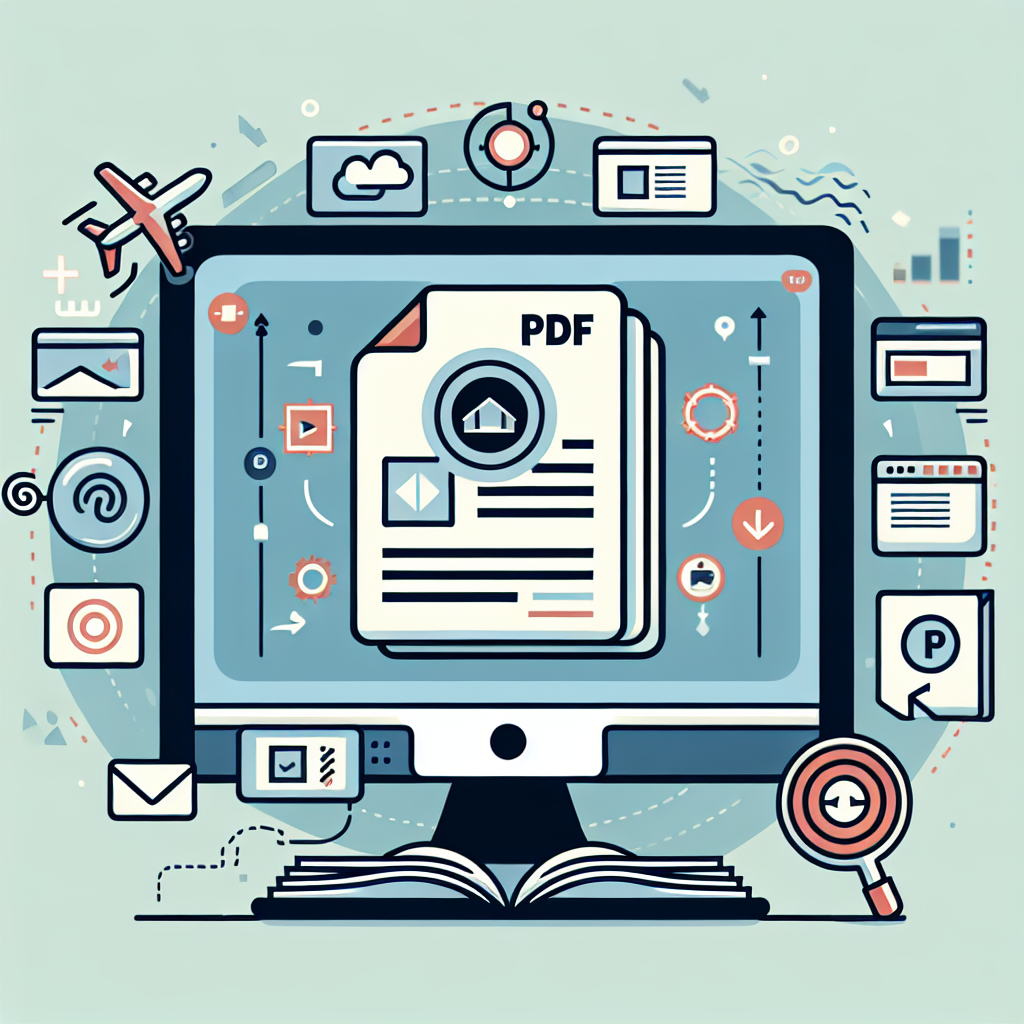
How to Use PDF For Free
PDF (Portable Document Format) files have become a standard way to share and view digital documents. They are widely used for their compatibility across different devices and operating systems. In this article, we will explore how you can make the most out of PDFs without having to spend a penny.

How to Install Adobe Acrobat Reader
Adobe Acrobat Reader is a widely used software for viewing, printing, and annotating PDF documents. Whether you’re using a Windows PC, Mac, or mobile device, installing Adobe Acrobat Reader is a simple process. Follow these steps to install Adobe Acrobat Reader:

How to Use Adobe Acrobat
Adobe Acrobat is a powerful software suite that allows users to create, edit, and manage PDF documents with ease. Whether you’re a seasoned professional or a novice user, learning how to use Adobe Acrobat effectively can greatly enhance your productivity. Follow these simple steps to harness the full power of this versatile tool:
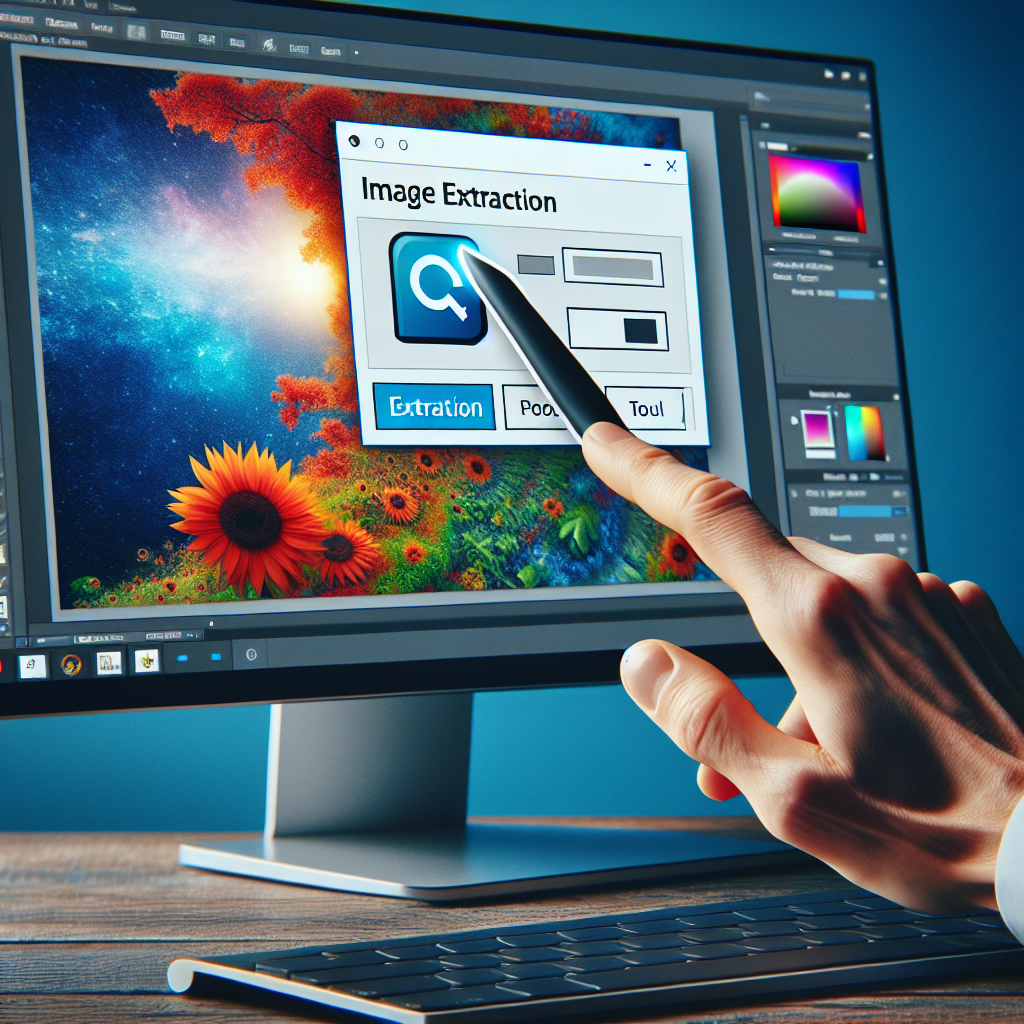
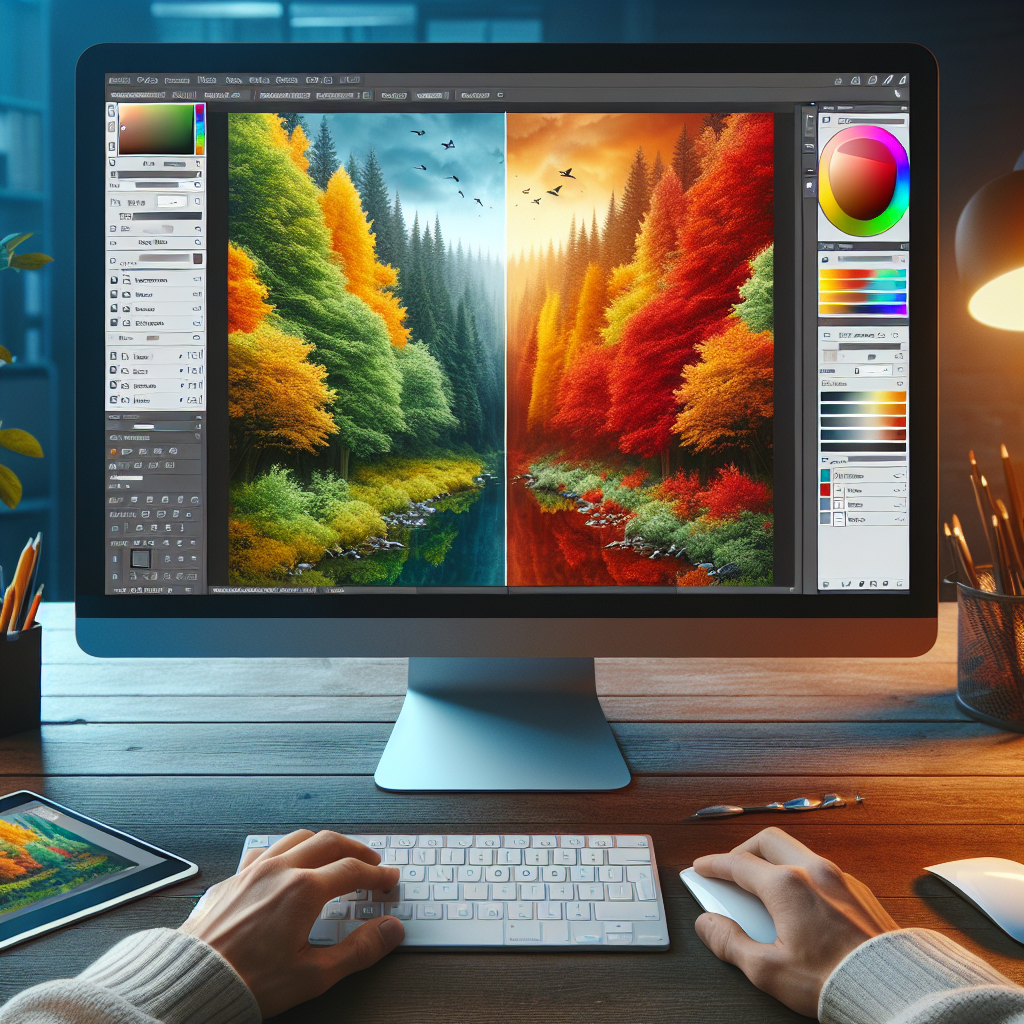
How to Extract an Image in GIMP
If you’re new to graphic design or photo editing, GIMP is a powerful and free tool that can help you manipulate images with ease. One common task you may need to do is to extract an image from its background. This process can be handy when you want to isolate an object or remove the background entirely. Here’s a step-by-step guide on how to extract an image in GIMP:
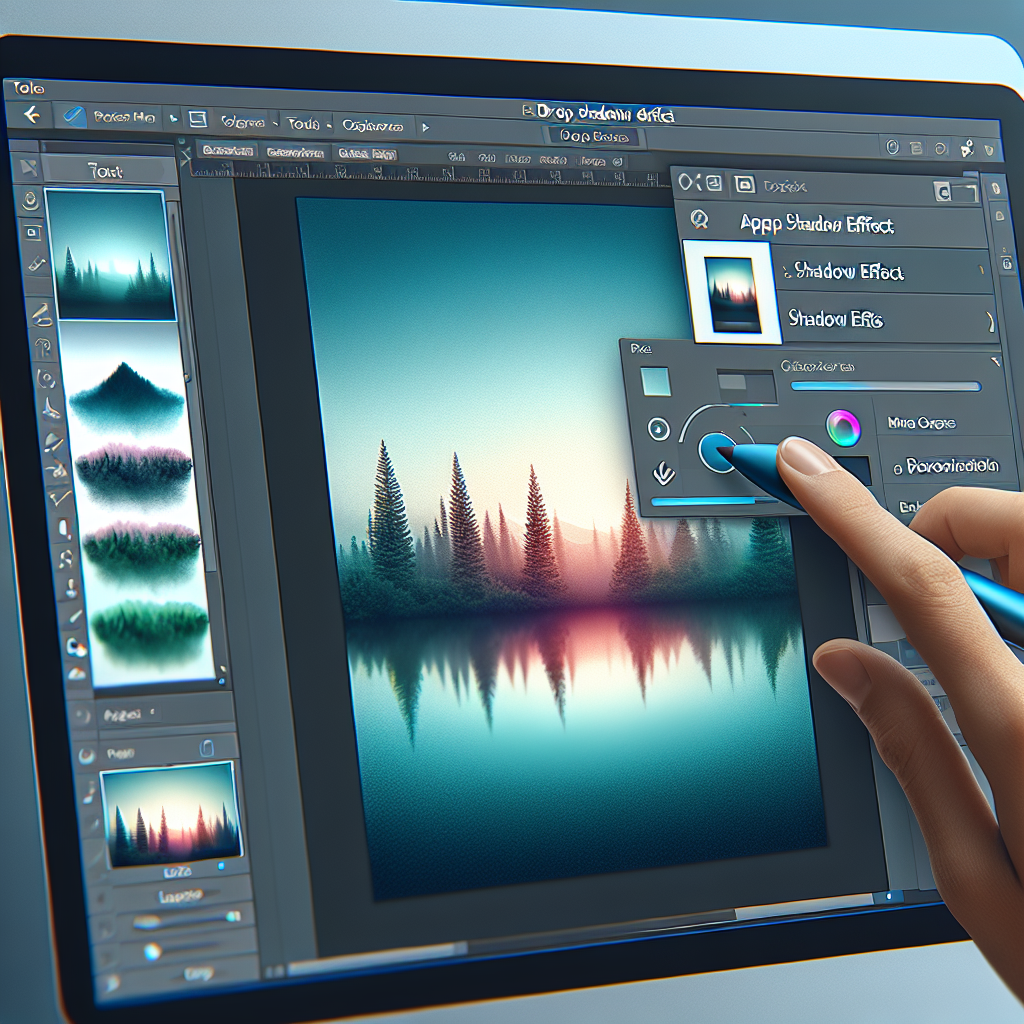
How to Use Drop Shadow in GIMP
Drop shadows are a popular design effect used to add depth and dimension to elements in various graphic design projects. In GIMP, a free and powerful graphic design software, you can easily create drop shadows to make your designs stand out.
How to Add a Vignette to a Photograph with GIMP
Adding a vignette to a photograph can help draw the viewer’s attention to the central subject, create a more dramatic atmosphere, or give a vintage look to your images. In this tutorial, we will walk you through the steps of adding a vignette to a photograph using the popular free and open-source image editor, GIMP.
How to Recolor Anything on Gimp
Are you looking to change the color of an element or object in your image using Gimp? Recoloring in Gimp is a straightforward process that can make a significant difference in the final look of your design. Whether you want to adjust the color of a product, create a unique artwork, or experiment with different color schemes, Gimp offers powerful tools to help you achieve your desired results.

How to Install Scripts Into Gimp
Gimp (GNU Image Manipulation Program) is a powerful open-source image editing software that offers a wide range of features for graphic design, photo retouching, and more. One of the advantages of Gimp is its ability to be extended with various scripts that can automate tasks or add new functionalities.

How to Reuse Water from Your Washing Machine
Washing machines are essential appliances in most households, but have you ever thought about the amount of water they consume with each cycle? Fortunately, there are eco-friendly ways to recycle and reuse water from your washing machine, helping you reduce water wastage and even save on your water bills. Here are some tips on how to effectively reuse water from your washing machine:

How to Build a Ferrocement Tank
Ferrocement is a versatile and cost-effective material used in construction, particularly for water tanks. Building a ferrocement tank requires meticulous planning and precise execution. Follow these steps to create a durable and long-lasting tank:
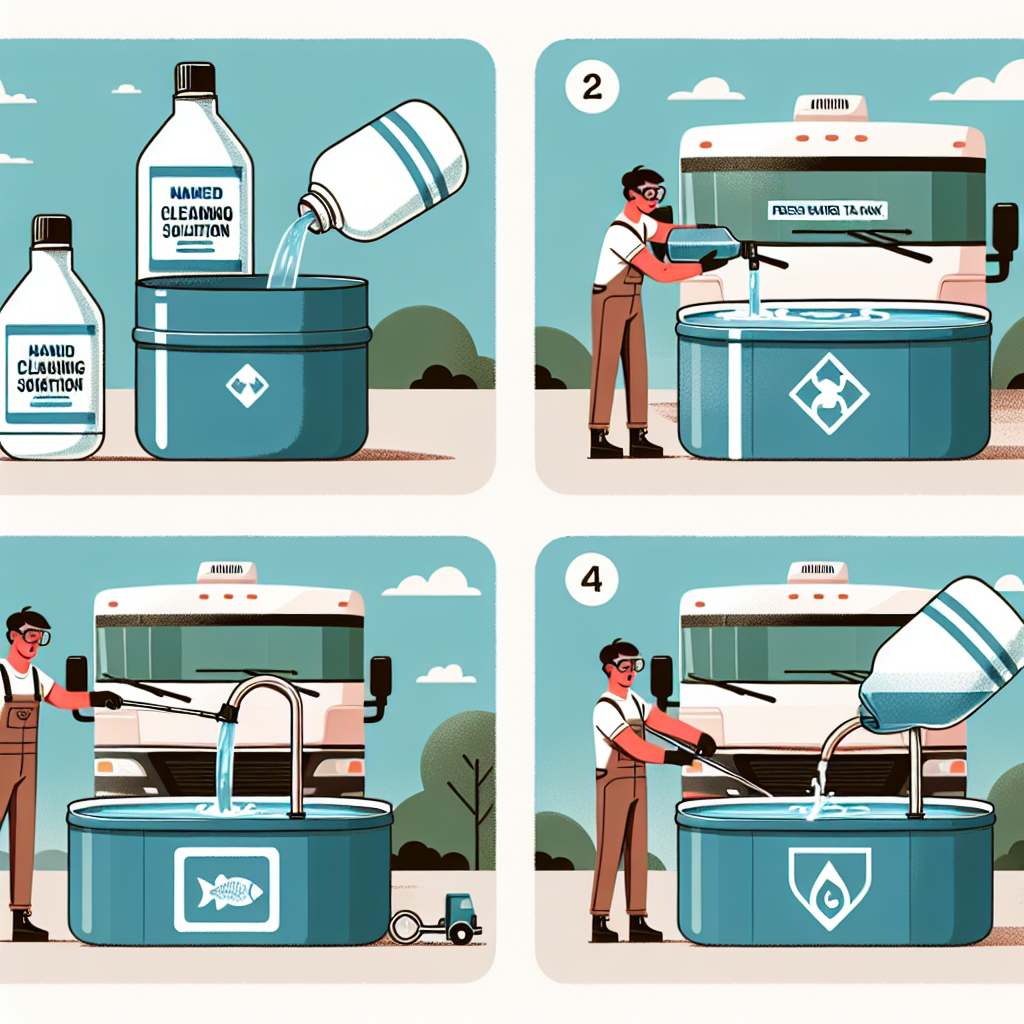
How to Clean an RV Fresh Water Tank
Regularly cleaning your RV fresh water tank is essential to ensure that you have access to safe and clean water during your adventures. Over time, sediment, bacteria, and algae can build up in the tank, affecting the water quality and potentially causing health issues. Follow these steps to properly clean your RV fresh water tank:

How to Work Out Water Tank Capacity
Calculating the capacity of a water tank is essential for various reasons, whether you are looking to install a new tank or simply need to know how much water it can hold. Here are the steps to help you determine the capacity of a water tank:

How to Conserve Water when Doing Dishes
When it comes to conserving water, every drop counts, especially during daily activities like doing dishes. By adopting a few simple practices, you can significantly reduce water wastage in the kitchen. Here are some tips to help you conserve water when washing dishes:

What is an IG Story Viewer?
Instagram Stories have become a popular way for users to share short-lived moments with their followers. These short videos or photos disappear after 24 hours, providing a more authentic and real-time glimpse into someone’s life.

The Best YouTube Converter to MP3: A Must-Have Tool for Music Lovers
In the digital age, music has become more accessible than ever before. With platforms like YouTube, we have an immense library of songs at our fingertips. However, sometimes we just want to enjoy our favorite tracks offline, without having to rely on an internet connection. This is where a YouTube converter to MP3 comes in handy.
What is a YouTube converter to MP3?
A YouTube converter to MP3 is a tool that allows you to convert YouTube videos into high-quality MP3 audio files. By extracting the audio from the video, you can create an MP3 file that can be saved on your device and played at any time.
Why use a YouTube converter to MP3?
- Offline listening: By converting YouTube videos to MP3 files, you can enjoy your favorite music even without an internet connection. This is great for road trips, flights, or areas with poor network coverage.
- No ads or interruptions: When you convert a YouTube video to an MP3 file, you eliminate the ads and interruptions that often come with online streaming. You can enjoy uninterrupted music.
- Build your music library: With a YouTube converter to MP3, you can create your own music library by downloading and organizing your favorite tracks. This way, you have full control over your collection.
Choosing the best YouTube converter to MP3
With so many options available online, it’s essential to choose a reliable and efficient YouTube converter to MP3. Here are a few factors to consider:
- Audio quality: Look for a converter that provides high-quality audio output. You should be able to enjoy your music in crisp and clear sound.
- Conversion speed: The conversion process should be fast and efficient. Nobody wants to wait for hours to convert a single video.
- Ease of use: A user-friendly interface makes the conversion process smooth and hassle-free for everyone, even if you’re not tech-savvy.
Conclusion
Having a YouTube converter to MP3 is essential for music lovers who want offline access to their favorite tracks. It allows you to enjoy uninterrupted music whenever and wherever you want. Just remember to choose a reliable converter that offers high-quality audio output with fast conversion speed. Start building your music library today!

What is an IG Story Viewer?
Instagram Stories have become a popular way for users to share short-lived moments with their followers. These short videos or photos disappear after 24 hours, providing a more authentic and real-time glimpse into someone’s life.

Best Budget Soundbar
If you’re on a budget but still want excellent sound quality, the Vizio SB3821-C6 2.1 Channel Soundbar is a fantastic option. This soundbar delivers impressive audio with its built-in subwoofer and two powerful speakers. The wireless Bluetooth connectivity allows you to stream music from your mobile devices easily.

Best Budget Chromebook
If you’re in the market for a new laptop and don’t want to spend a fortune, a budget Chromebook might be the perfect choice for you. Chromebooks offer a lightweight, easy-to-use operating system that is perfect for tasks like web browsing, email, and document editing. In this article, we will discuss the best budget Chromebooks available, so you can find the perfect one to meet your needs without breaking the bank.

The Best Budget Mechanical Keyboards: Finding Quality at an Affordable Price
When it comes to computer peripherals, the keyboard is an essential tool that can greatly enhance your productivity and overall experience. Mechanical keyboards, with their tactile switches and customizable features, have become increasingly popular among gamers, coders, and professionals alike.

Best Mouse for MacBook Pro
MacBook Pro is known for its sleek design and powerful performance, making it a popular choice among professionals and creatives. While the trackpad on the MacBook Pro is impressive, some people prefer the precision and control that a mouse provides. If you’re in the market for a mouse for your MacBook Pro, we’ve got you covered. In this article, we will explore the best mice options available for MacBook Pro users.

The Best 1440p Monitor for an Immersive Gaming Experience
When it comes to gaming, having the right monitor can make all the difference. If you’re a gamer looking for a high-quality display with stunning visuals and crisp details, a 1440p monitor is an excellent option to consider.

What is an IG Story Viewer?
Instagram Stories have become a popular way for users to share short-lived moments with their followers. These short videos or photos disappear after 24 hours, providing a more authentic and real-time glimpse into someone’s life.

What is an IG Story Viewer?
Instagram Stories have become a popular way for users to share short-lived moments with their followers. These short videos or photos disappear after 24 hours, providing a more authentic and real-time glimpse into someone’s life.

How to Download TikTok: Step-by-Step Guide
TikTok has taken the world by storm with its short-form videos and creative content. Whether you want to showcase your own talents or enjoy watching others, downloading the TikTok app is the first step to get started. In this article, we’ll guide you through the process of downloading TikTok on your device.

The Benefits of an Ad-Free Internet
In today’s digital age, ads have become an integral part of our online experience. They are everywhere, popping up on websites, interrupting videos, and even infiltrating our social media feeds. While advertising is necessary to support many online platforms and services, the constant bombardment of ads can be overwhelming, intrusive, and disruptive.

How to Bookmark on Internet Explorer
Bookmarking websites is a useful feature that allows you to save your favorite webpages for quick access. In this article, we will guide you through the simple steps to bookmark on Internet Explorer.

How to Transfer Money through Internet Banking
Internet banking has revolutionized the way we manage our finances. One of the key features it offers is the ability to transfer money conveniently and securely. If you’re wondering how to transfer money through internet banking, this article will guide you through the process.

How to Troubleshoot and Fix ChatGPT Internal Server Errors
How to Troubleshoot and Fix ChatGPT Internal Server Errors

What is an IG Story Viewer?
Instagram Stories have become a popular way for users to share short-lived moments with their followers. These short videos or photos disappear after 24 hours, providing a more authentic and real-time glimpse into someone’s life.

How to Play Fortnite on Mac
Fortnite has become one of the most popular online multiplayer games in the world, and it’s no surprise that you want to play it on your Mac. In this article, we will guide you through the steps to play Fortnite on your Mac.

How to Copy and Paste on Mac
Copying and pasting is a fundamental skill that every computer user should know. Whether you are writing an email, creating a document, or browsing the web, knowing how to copy and paste can save you time and effort. Mac computers offer a user-friendly interface that makes copying and pasting a breeze. In this article, we will guide you through the simple steps to copy and paste on your Mac.

The Importance of Using a DPI Analyzer for Website Performance
In today’s digital landscape, having a high-performing website is crucial for any business or organization. Slow loading times can lead to a poor user experience, increased bounce rates, and lower search engine rankings. One tool that can help improve website performance is a DPI analyzer.

Instagram Login on Chrome: Easy Steps to Access Your Account
Instagram is one of the most popular social media platforms, boasting over one billion active users worldwide. Whether you are an influencer, a business owner, or just an avid user, accessing your Instagram account on Chrome is a convenient way to stay connected. In this article, we will provide you with a step-by-step guide on how to log in to your Instagram account using the Chrome browser.
Twitter for Sports Updates: Sharing Highlights and Commentary
Gone are the days of waiting for the evening sportscast. In the lightning-fast realm of Twitter, sports news explodes in real-time, fueled by fans, journalists, and athletes themselves. Highlights fly, opinions clash, and memes erupt with every buzzer-beater and fumble. Forget passive spectating; Twitter turns you into a live commentator, sharing the thrill of the game with your network and immersing yourself in the vibrant sports conversation unfolding on your feed.

TikTok Motivational Speeches: Inspiring Your Audience in 60 Seconds
Forget lengthy lectures and dry self-help books. In the fast-paced world of TikTok, motivation comes in bite-sized bursts. Sixty seconds are all you have to spark a fire, ignite a dream, and empower your audience. Don’t underestimate the power of short, impactful messages. Share your wisdom, your struggles, your triumphs, and inspire others to chase their own goals.
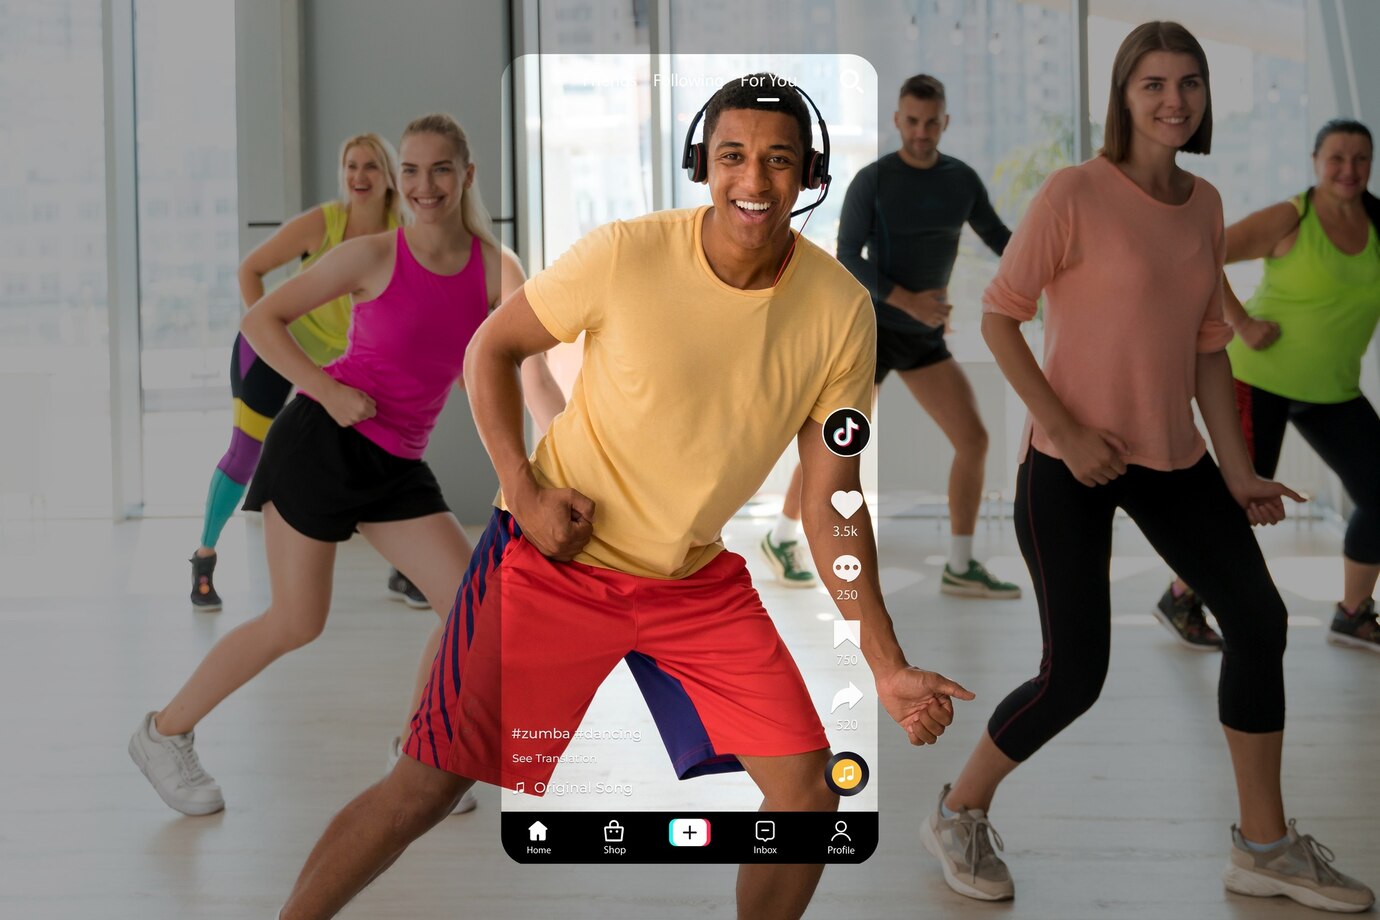
Instagram Reels Dance Challenges: Encouraging User Participation
Attention, aspiring viral sensations! Instagram Reels is calling, and it wants you to bust a move. Dance challenges reign supreme on this platform, captivating audiences with catchy beats and infectious choreography. But Reels isn’t just about watching; it’s about joining the party. Hop on the trend, put your own spin on the steps, and share your unique flavor with the world.

TikTok DIY Beauty Hacks: Quick and Affordable Tips
In the age of social media, beauty enthusiasts are turning to platforms like TikTok for quick and innovative do-it-yourself (DIY) beauty hacks. These hacks often use everyday items found at home to achieve stunning results without breaking the bank. From skincare routines to hair treatments, TikTok is a treasure trove of creative and cost-effective beauty solutions. Let’s explore some of the most popular TikTok DIY beauty hacks that can elevate your beauty routine to the next level.

Instagram Carousel Ads for Event Promotion: Building Excitement
Forget static flyers and stale posters. In the visually vibrant world of Instagram, event promotion shines brightest through carousel ads. Tell a story, evoke curiosity, and build anticipation by weaving together captivating images, eye-catching videos, and informative text. Each frame becomes a brushstroke painting your event’s unique atmosphere, enticing viewers to swipe, learn more, and join the adventure.

Twitter for Mental Health Awareness: Providing Support and Resources
Twitter isn’t just for cat videos and celebrity gossip. It’s also a powerful platform for amplifying voices and breaking down stigmas surrounding mental health. Share your story, offer words of encouragement, and connect with a community that understands. Use hashtags to spread awareness, amplify resources, and offer support to those struggling.

Comparing the Best Instagram Story Download Tools
The fleeting glimpses of friends’ adventures, celebrity updates, and mouthwatering recipe demos – Instagram stories captivate, but they don’t always stick around. Enter the mighty story saver, the digital hero rescuing content from disappearing into the algorithm abyss. But with a plethora of options out there, from apps to browser extensions, finding the perfect savior can feel like navigating a minefield of pop-ups and confusing interfaces. Fear not, fellow Instagrammers! This guide delves into the top story saver contenders, dissecting their features, compatibility, and ease of use.
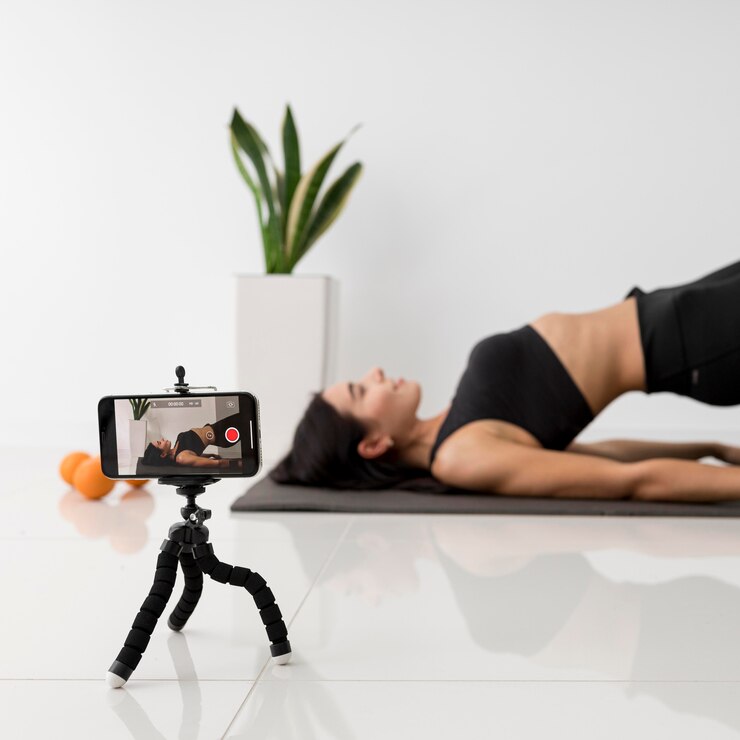
Instagram IGTV Yoga Classes: Hosting Virtual Wellness Sessions
Unroll your mat and join the global yoga community streaming live on Instagram IGTV. Certified instructors guide you through poses, offer personalized insights, and create a virtual studio in the comfort of your own home. Breathe in the serenity, flow through postures, and find your inner peace, all with just a swipe and a tap. IGTV yoga classes make wellness accessible, convenient, and inspiring, proving that mindfulness and connection transcend physical barriers, one downward-facing dog at a time.